
Week Commencing December 9th 2019
Market Overview
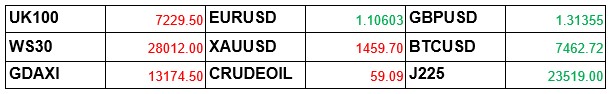
The markets this week offered numerous rounds of surprises. Firstly GBP reach a 2 year high against the EUR as Brexit and UK election noise heightened as we head into Thursday’s election date. The same noise also say cable reach $1.31, after consolidating at $1.29 for the few last few weeks after it had rallied to that level from $1.22. However as it was the first Friday of the new month, the majority of the eyes in the markets were all glancing towards the US NFP jobs number in which we previewed ( watch here). The expected was 183k, however came in at 266k. This is the second month where the number has been at least 40k better than the forecasted figure. As a result the likes of Gold moved $20 in 2 hours, and SP500 recaptured historical highs.
Market Preview
With the UK election taking place this coming Thursday, market will likely be focused on how this fundamental event will impact UK and GBP related markets. GBPUSD, UK100 and EURGBP are likely to be big movers depending on the decision the UK voters choose to take. A FOMC rate decision will also be on the cards as markets look for more volatility from the US post a stronger than expected jobs day. This will likely see further Gold moves as we see how the metal reacts after the $20 drop on Friday.
Economic Data View
- Monday:CNY New Yuan Loans CNY (NOV)
- Wednesday: USD FOMC Rate Decision (Lower Bound) (DEC 11)
- Thursday: GBP U.K. General Election (All Day)
See more
Technical view
Contents
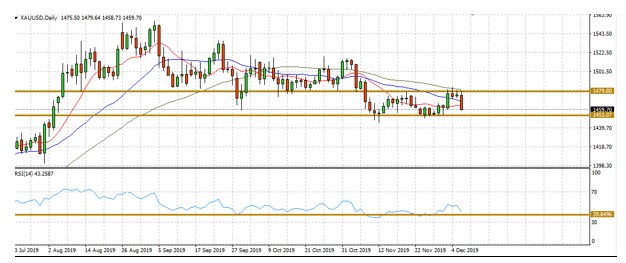
XAUUSD – Daily Chart
Gold continued it consolidation this week moving in between the support of $1453 and resistance of $1479. The resistance was mainly held due to Fridays NFP number, and to no surprise the selloff ended once the markets reached the floor once more. FOMC next week will hopefully see volatility continue as markets will once again wonder if we will see this 5 week consolidation continue in this current range. The Moving averages still show us the potential for an upwards cross, the catalyst of which could be what sees this current resistance come to an end.
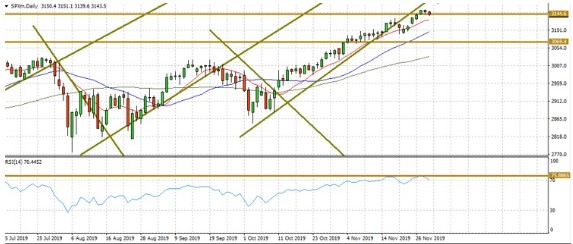
SP500 – Daily Chart
As the Gold selloff ensued we saw further runs on the SP500 which attempted to break the recently established all time high of 3150. The markets hit the 3144 resistance, and the hope of bulls will be that trading on Monday will see this set a new record. However the technicals prior to the dead cat bounce suggested that there could be runs on the short side. The moving averages still suggest that this could be a possibility, will RSI still showing an immense amount of bullish strength as we are near overbought levels. Could bearing news from the FOMC be on of the forces of change to see the technicals actioned and a bear run take place?
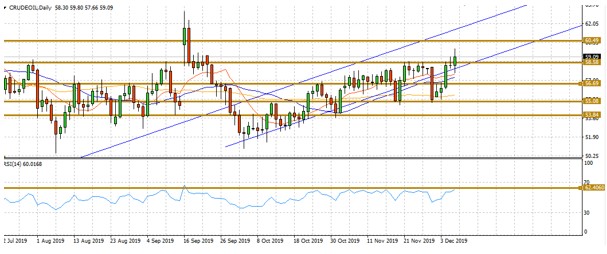
CrudeOil – Daily Chart
Crude Oil finally broke the $58 resistance and even edged close to the 2nd resistance point of $60, but fell short on Friday trading. This run mainly taking place within an ascending triangle channel. The news of Saudi Aramco being the largest IPO in the history of the world was on the main contributors to this run. Which also coincided with the 10 day moving average refusing to crossover downwards on it’s 25 day counterpart. However now at another resistance point, both with the RSI and actual price point, could this be where sellers send this market back down?
Charts analysed and narrated by Eliman Dambell – edambell@tvmarkets.com

