Week Commencing November 25th 2019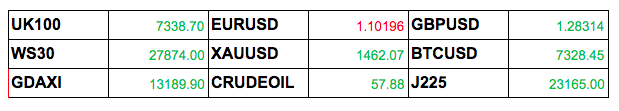
Market Overview
All eyes were on the FOMC report this week, with many believing that last months rate cut was due to an economic downturn. However Wednesdays Minutes showed the opposite, with the FOMC easing concerns of the economy. As a result we saw Gold continued to tumble reaching a week low of $1455 asa result. In other news we saw 2 huge rallies in Crude as the energy started the week on $58 per barrel, however after a 2 day selloff, Wednesday saw us at $55, but an immediate rally saw us finish the week where we started, and the markets closing at $57.88.
The positive news coming out of the FOMC minutes, also saw USD gaining versus several g7 paris, including GBP. These gains, led to brief selling of within index US markets.
Market Preview
The upcoming week, is set to be an interesting one. Firstly we have thanksgiving, so markets in the USwill be closed on Thursday as a result. With many rushing to Black Friday sales on Friday. Besides the holiday season, traders are looking forward to GDP and consumer confidence numbers this Tuesday and Wednesday respectively.
This could lead to further changes in direction within Gold, SP500 and other global currencies depending on the health of the US economy will face further fundamental scrutiny.
Economic Data View
- Tuesday: USD Consumer Confidence Index (NOV)
- Wednesday: USD Gross Domestic Product Annualized (QoQ) (3Q S)
- Friday: EUR German Unemployment Change (000’s) (NOV)
See more
Technical view
Contents
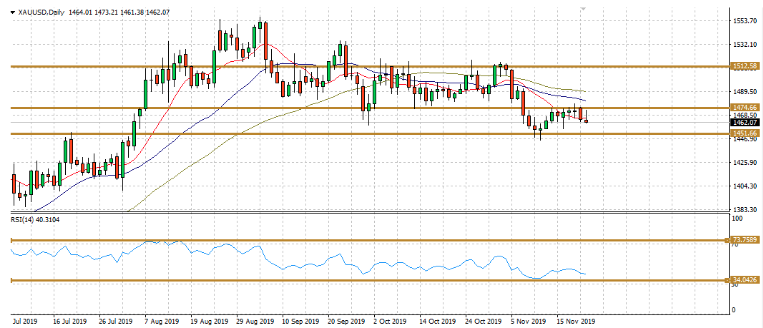
XAUUSD – Daily Chart
Those who stated that Gold was to enter a new range of consolidation seem to be right (so far). After trading within $1512 and $1474 for the last 4-5 months, the last 10 days has seen Gold start to consolidate between $1451 – $1474. After attempting to break back into the $1470s and above, The better than expected outlook from the FOMC sent this metal back to its current floor.With volumes severely still oversold, could negative fundamental data we forecasted above, cause a breakout here?
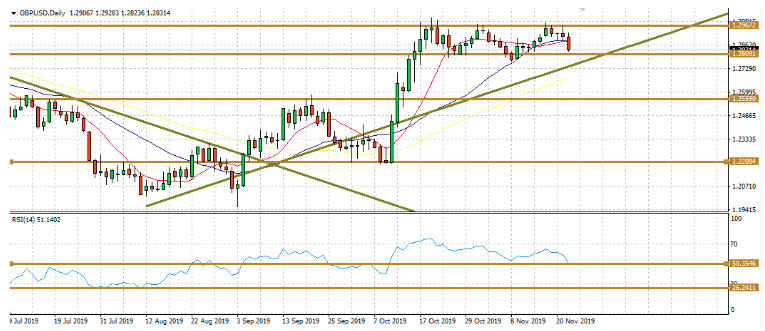
GBPUSD – Daily Chart
After the huge jump in early October where it seems that there were possibilities for a Brexit deal, the news that followed saw cable enter a streak of consolidation. This $1.30 – $1.28 range has been held for the past 3 weeks, and this weeks FOMC run led to us finding us back at the floor. USD gaining in strength, ironically also weakening recent all-time highs in index markets like the SP500. Although the momentum of moving averages do show us a sideways trend, the prospect of an eventual downward cross still exist. With the RSI now at the halfway point of 50, sellers may be waiting on the other side within 48-46 before they really start selling.
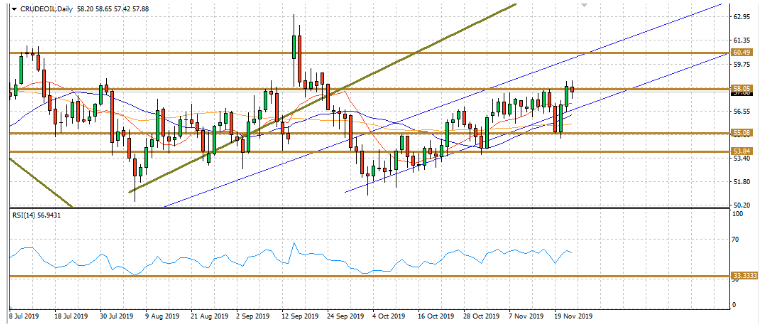
Crude Oil – Daily Chart
Those of you who read last weeks newsletter would likely believe you are looking at the exact same chart as last week. This is because the uncertainty in Crude has only grown in the past few days. The start of the week saw further details on the Aramco deal revealed, as a result we saw selloffs ath the $58 resistance level, where the bears have recently dominated. However when US crude inventories showed a lower than expected stockpile of liquid gold, we saw prices rise as a response. Briefly breaking out on Friday, can next week hopefully provide further rises?
Charts analysed and narrated by Eliman Dambell – edambell@tvmarkets.com
Adam Saward & Eliman Dambell
Tradeview LTD
1 St Katherine’s Way
London
E1W 1UN
Direct: 0203 2392987