Ever heard of “buying the dip”? In trading lingo, this means buying an asset after its value has fallen. The presumption is that the current lower price represents a bargain because the ‘dip’ is just a temporary blip and the asset will rebound and rise in value over time.
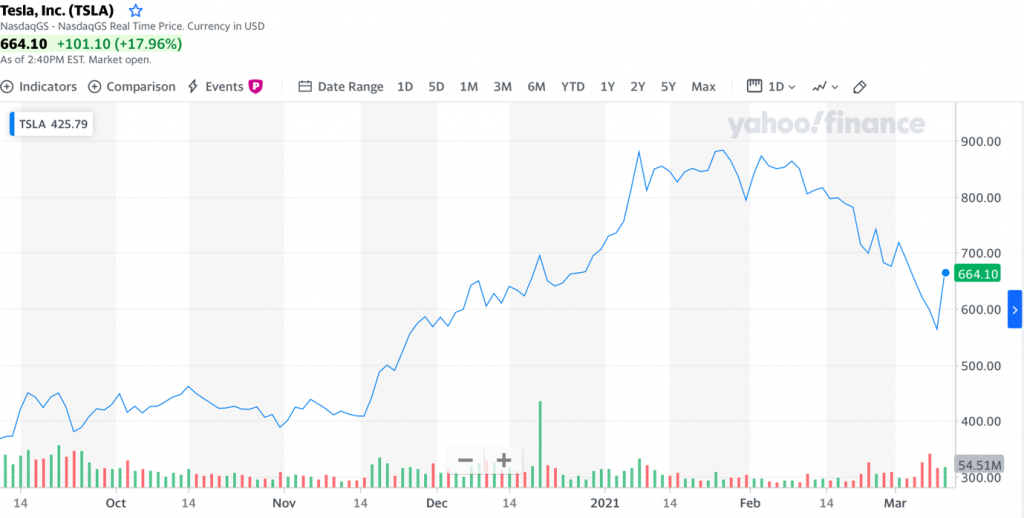
Tesla is a great example of one of the trendy stocks that recently suffered a dramatic correction after a 2020 rally–with the electric car maker’s shares on Monday, recorded losses of a third of its value for the third time in a year. The general sentiment amongst investors on Tuesday open is an opportunity presented to investors to buy the stock cheap – buying the dip.
Related: GameStop & Tesla: A famous investor looks for his new Big Short
This is my favourite long-term approach and I will be examining the three parameters that is generally used by top traders to grow small trading accounts.
According to data from Tradeview copy trade algorithm, most top traders prefer to buy the morning panic, buying the dip, or buying the bounce. These terms are all for the same technical trading idea. It’s one of the oldest trading strategies ever devised and that is because this approach gives you a greater chance of profiting from the trade and a higher return on risk. Whether you have a small account and can’t short, if you’re unable to short, or are part-time trading when working full-time and only having time for the first hour of the market open, this will be the ideal approach for you.
Contents
Parabolic Daily Chart:
According to internal surveys carried out within Tradeview Copy trade system, when looking for a stock dips to buy, most top traders want to see a parabolic daily chart to the upside, and not just any daily chart.
For a good example of what a parabolic upside daily chart looks like, see the chart below:
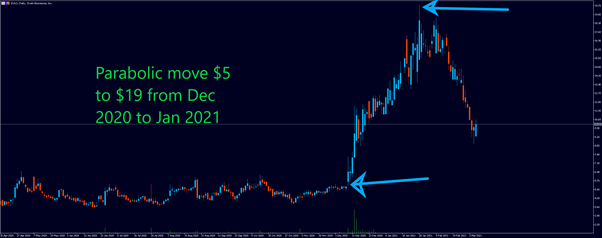
In the chart example above, EVLO was going straight up from mid-December 2020 to the end of January 2021, according to the daily candles. That’s a total of five weeks in a row. Although there were a few red days, it rallied for 11 days straight towards the end.
This type of chart setup, or pattern, is generally called parabolic daily chart. When a chart is set up like this, it indicates that there is a lot of emotional and greedy buying from traders. This is on top of large funds and investors pouring money into EVLO after JMP securities-initiated coverage on the stock with an outperform rating and announced a price target of $27 per share in mid-November.
So, while knowing the news and seeing the nice daily breakout are great, you do not want to be a bag-holding breakout buyer. Don’t buy breakouts, particularly in low-float penny stocks, as we’ve seen recently with stocks like HMHC.
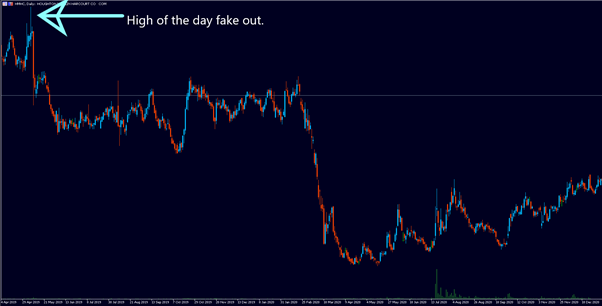
A lot of the time, these breakouts end up being a ruse. These floats will sometimes pop for 10 cents and then dump 30, 50 cents.
Yes, you could make money by buying breakouts. However, in most cases, the risk is not worth it.
That doesn’t seem like a good idea to our most profitable stock traders, particularly when you’re trying to build a small trading account.
During the survey, we found out that 80% of our most profitable stock traders prefer to buy the dips at the support levels on stocks with a solid parabolic daily chart, like EVLO. Now you must be wondering how exactly do they find that strong support levels to buy the bounce? This question brings us to the second criteria.
Draw Daily Support/Resistance Levels
The second criteria is to draw support/resistance levels on the daily chart. You can’t just buy any support/resistance level; the best levels are almost always going to show on the daily chart.

So, using EVLO as an example of a parabolic daily chart, the resistance level on the daily chart is around 9.75. That’s a line of resistance dating back to the beginning of February 2019, and then in December 2020, this resistance was broken. As a result, when a resistance line is broken, it becomes support and vice versa.
As seen in the chart, EVLO broke the previous high of 9.75 early in December and rallied to a new high of 19.80. After reaching new highs, the stock began to fall and dipped to this level of 9.70. That is the dip most top stock traders look for.
NOTE: These daily levels of support and resistance are never the same to the cent. They represent a broad range of supply and demand.
High Short Interest
Remember the first criterion for this setup is the parabolic daily chart? When a stock goes parabolic, it means that it has rallied for a couple of days with no big pullback.
At the same time, if a stock rallies up to the moon, there are still funds and individuals who try to short it. And, indeed, a chart that looks like EVLO is theoretically extended and should be selling off.
The high short interest is number of shares outstanding that are actually sold short and must be bought back to cover the position. Short interest in a stock may be expressed as a percentage of total shares outstanding or as an amount. A short interest number indicates how many shares of a stock are actually short, while a short interest percentage indicates what percentage of all outstanding shares are still short.
The reason why a high short interest is beneficial to a long trader looking to buy the morning bounce is because you know whoever is heavily shorting these stocks will look to buy to cover. Short sellers buying to cover their positions, as well as new investors coming in to buy the stock at a lower price and bring in the kind of volume that you can take advantage of for a potential upside to a retest of the highs.
How to Check Short Percentage
The most up-to-date information about trade ideas can be found on Stock screener/scanner to show the morning’s short interest, mid-day momentum scanners, distance scanners and It’s even visible in the stock details.
The following are some key guidelines according to Tradeview copy trade research:
- Short interest of less than 10% indicates bullish sentiment.
- When short interest exceeds 10%, bearish sentiment starts to emerge.
- When short interest exceeds 20%, strong bearish sentiment emerges.
- When short interest exceeds 30%, it may indicate that the bearish price cycle is nearing the end.
- Short sellers can be exposed to the risks of a short squeeze or a temporary “dead cat bounce” if short interest exceeds 40%.
Key Takeaways
Higher success rate
Better Risk/Reward
Suitable for small accounts
Conclusion
This buy-the-dip strategy, as well as overnight swing strategy are the two main strategies our best performing traders deploy to develop small accounts. Patience is important in all of these setups, as is being okay with not trading if the setup isn’t perfect. Finding a stock that meets all three requirements won’t happen every day